
Published on Livewire 08/06/2026 (Original Article Here) – Romano Sala Tenna
‘Extraordinary’ returns are achievable, but not how you may think.
In December 2025, we were proud to clock up our 20th year in operation. Along the way we have often felt as though ‘nothing is happening’ or worse that ‘we are going backwards’! Yet over that timeframe, the fund has generated a return of 578% net of all fees. How has this happened?!
Before we answer that question, it is worth highlighting a common fallacy. Which put simply, is that investors often think that quick and explosive returns are the secret to ‘extraordinary’ wealth. In reality the opposite is often true: disproportionately chasing quick and explosive returns often leads to a loss of capital. Yes, we may win ‘big’ on a trade, but the level of risk that you have taken on will inevitably yield the opposite outcome – it is often a question of time.
What is really required is a consistent level of return above and beyond the index. A return generated with low(er) risk, a high degree of diversification, liquidity, transparency and replicability. When we are able to generate such a return, we can utilise the power of time to compound our capital. And there is no greater force in finance. As Benjamin Graham wrote “The magic of compounding returns is the biggest mathematical discovery of all time.”
In our own journey, this is clearly laid out. In the graph below, the blue line represents the capital growth from the All Ordinaries Index (i.e. minus dividends) over the past 2 decades. As we shall discuss further on in the article, capital growth on the ASX over the past 2 decades has been well below the long-term average. At a total compounded return of just 90%, it really has been a lousy period, impacted by the heavy drawdown during the 2008 GFC.
The maroon line represents the All Ordinaries Accumulation Index – which has actually been the best performing index in Australia over most timeframes. This index combines capital growth and dividends. As we can see, when compounded for 2 decades, the return was 335%.
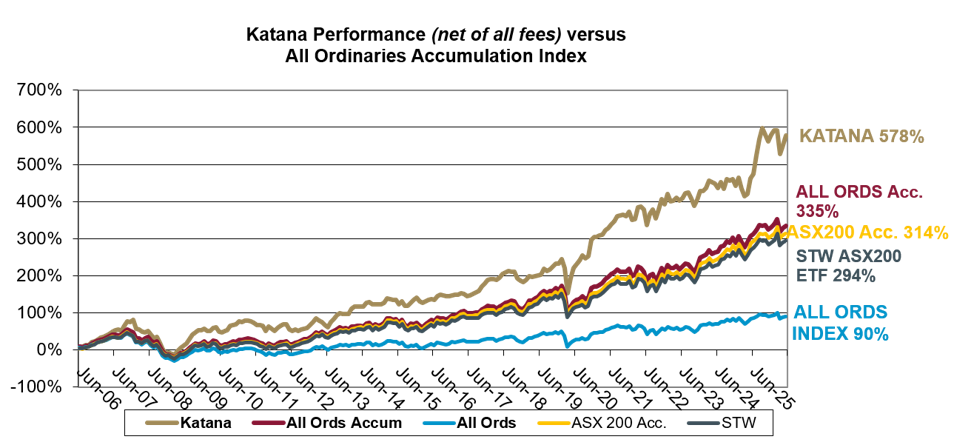
Now consider the gold line. By generating a modest 2.36% additional performance each year, the returns have nearly doubled to 578%. An extra 2.36% per annum – when compounded over this time frame, added an extra 244% return. That is the power of time on our capital. The power of compounding.
‘Normalised’ ASX Returns
Over the past 2 decades, the ASX accumulation index has actually experienced a period of pronounced underperformance relative to its long-term average.
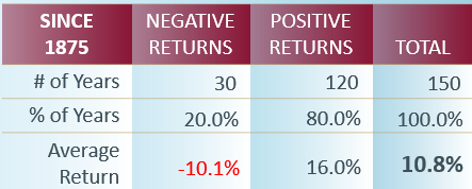
As at the conclusion of 2025, we have 150 years of ASX data at our disposal. During this time, there have been 120 up years and 30 down years. So exactly 4 out of 5 years the market has risen, and 1 out of 5 years you are wondering why you invested in the stock market!
During the 1 in 5 years when the market did drop, it fell by an average of -10.1% (dividends less capital losses). Over the same timeframe, when the market rose, it was by an average of 16.0% per annum (dividends plus capital growth). When we combine positive and negative years, we arrive at an average of 10.8% per annum. So, over the past 150 years, the accumulation index has generated an average return of 10.8% per annum (##refer to notes at end of article).
However, if we look at the experience over the past 2 decades, we note that the returns from the ASX have been well below the long-term average. Over the past 2 decades, the compound annual return has averaged a lowly 7.6%, due largely to the impact of the 2008 GFC. Dividends were down marginally at 4.3% per annum on average. But we can see that capital growth was less than half of what we would normally experience.
Whilst some (perhaps many) will point to a structural decline in the performance of ASX companies, we remain cautiously optimistic that this is part of a long-term cycle. A cycle that has repeated itself many times in the past.
So let’s consider what it would look like if the ASX was to return to its long-term average of 10.8% per annum. Over a 10-year period – through the power of compounding – the average return since 1875 would be 179%. That’s the equivalent of nearly 17 one-year returns (of 10.8% per annum).
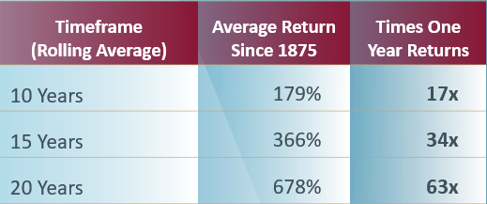
If we compounded for an extra 5 years, the average return would have been 366% or the equivalent of 34 one-year returns. Go an extra 5 years again, and after 20 years, the average return was 678%. That’s the equivalent of generating ~63 one-year returns of 10.8% per annum. But achieved in just 20 years through the effect of compounding.
‘Normalised’ ASX Returns + Out-performance
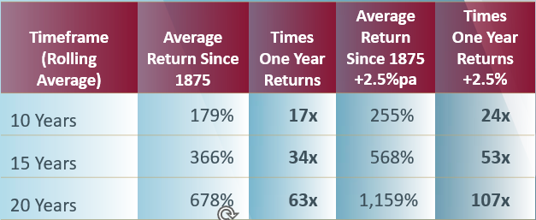
Roughly 1 in of 4 fund managers have outperformed the index net of fees over any extended timeframe. Some by ~2.5% per annum (such as Katana) or more. These funds have long term track records based on competent teams and sustainable processes (note past performance is no guarantee of future performance).
Now consider if
1. The ASX return was to perform in-line with its long-term average (10.8% per annum) and
2. You were able to invest in a fund that averaged 2.5% per annum above the index
(net of fees).
IF you were able to do this, what would it look like? In short it would look ‘extraordinary’.
By compounding at the ASX’s long term rate of 10.8% per annum plus 2.5% alpha (below), our capital would have grown to 255% within 10 years. The equivalent of 24 one-year returns.
As we allow the effect of time to increase and accelerate, this would grow to 1,159% over 20 years. That’s the equivalent of earning 107 one year returns in just 20 years.
These really are extraordinary returns. But these returns have been achieved in a manner that is realistic and attainable for those who are patient and diligent.
We don’t need to make quick and risky returns to retire wealthy. We simply need to find a source of returns that is ‘modestly’ above average, liquid, low risk and replicable. And then allow time to do the work.
Hub and Spoke Model
At the personal level, we have employed a ‘hub and spoke’ approach. The bulk of our funds have been invested in a stable diversified, long-term fund (clearly in our case Katana!). We think of this as the hub.
Separately, as seasoned investors (i.e. we have made every mistake possible so now have some idea of what we are doing!), we continue to take smaller positions in higher risk opportunities. Opportunities that if they lead to loss of capital do not meaningfully impact our overall wealth. But if they are successful, can provide a meaningful return relative to our overall financial position. If and when such opportunities come to fruition, we continue to retain an increasing balance for the next spoke(s). But we quarantine a further portion back into the ‘hub’. Where our capital is secure and compounds at a steady rate. If you use an external fund, this frees up time, brain space and emotional bandwidth to focus on the next spoke(s).
Using this approach, it is genuinely extraordinary to see how much our hub has compounded over time.
In many ways the hub and spoke model is counterintuitive to the traditional concept of ‘rapid’ wealth generation. But the race is not won by the swift. It is won by those who minimise drawdowns, preserve capital and generate a solid return that can be replicated over time. In doing so, the forces of compounding increase our capital and at an ever-accelerating rate.
And that is the key lesson from 20 years of investing :
a diversified, lower risk, proven process compounded over time, is the safest and surest way to attain ‘extraordinary’ wealth.
#Notes to Statistical Calculations
1. Past performance is no guarantee of future performance.
2. Accurate dividend data is not available prior to the establishment of the All Ordinaries Accumulation index (XAOAI) in 1979. Prio to 1979, the All Ordinaries Index measured capital growth (only).The XAOAI has averaged a dividend yield of 4.51% since inception 46 years ago. To arrive at an approximation of the long term per annum average return (capital growth plus dividends), the average dividend yield since 1979 was extrapolated over prior years.
3. 10.8% per annum is a linear statistical average, calculated by summating each calendar year return since 1875 and dividing by the total number of years being 150.
Due to the mathematical anomaly of the impact of % gain versus % loss, this figure does not perfectly reflect the average annual compounded return.
4. For example, a 20% drawdown in year 1 followed by a 20% return in year 2, would yield a linear statistical average of 0% return per annum (-20%+20%) /2. However, when calculated as a compound return, the figure would be negative -2.02% being ((100%-20%)*(100%+20%))^(1/2)-100%.
5. Allowing for the statistical impact of drawdowns, the compound average annualised return is 9.7% per annum, calculated as ((100%+year1)*(100%+year2)*….(100%+year 150)) /^ (1/150) -100%.
6. The compound annual over the 2 decades concluding 2025 was disproportionately impacted by the unprecedented drawdown incurred during the 2008 GFC (as per the statistical anomaly detailed in point 4).