Much has been written about the ‘sudden supply side problem’ in the oil market, predicated ostensibly by US shale. In our view, this doesn’t make sense. Let me explain why.
First of all, there was a not-so-sudden ‘supply side problem’ in the oil market for much of the past six decades. An oversupply of cheap oil was the very reason that OPEC was formed some 56 years ago, in 1960. The then foundation members – Iran, Iraq, Kuwait, Saudi Arabia and Venezuela – recognised that they possessed large quantities of oil that could be produced very cheaply, and that the best way to regulate the output and hence price, was to form a cartel.
Back in 1960, the average price paid for a barrel of oil was $US1.63, total production was 21 million barrels of oil equivalent (mboe) per day and the US produced just on 7 mboe per day – almost exactly one-third of global production. But most relevant to the current day is that spare capacity was substantial, between 42% (US Office of Oil and Gas) and 50% (Chase Manhattan Bank estimate).
By comparison, and despite the arrival of supposedly cheap shale production, the oil market today is exceptionally tight. Yes, exceptionally tight.
The latest data from the International Energy Agency (IEA) forecasts that worldwide demand for oil will average 96 mboe per day during 2016. Spare capacity – as defined by that which can be brought on stream within 30 days and produce for longer than 90 days – is in the order of 2.4 mboe per day, or approximately 2.5% of global demand.
Spare capacity has declined from around 50% to 2.5%. And alarmingly, approximately 85% of the ‘spare capacity’ resides with one country – Saudi Arabia. When demand overtakes oil supply, the dramatic hiatus in oil developments over the past two years will exacerbate the problem.
So talk of a ‘sudden supply side problem’ appears ill-founded and indeed there would now not even appear to be a supply side problem from an historical perspective.
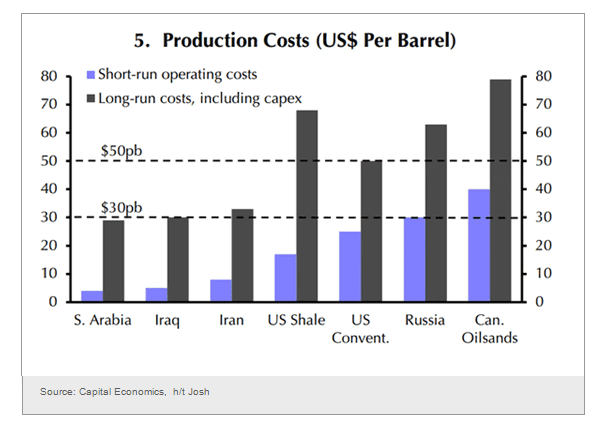
Part of the myth around the supply side issue has been generated and perpetuated by a misunderstanding of the true all-in sustaining cost (AISC) of producing a barrel of oil. The graph from Capital Economics below is perhaps the most important graph for oil investors.

There is a quantum difference between the short-term costs of producing a barrel of oil from an existing well already tied in to existing infrastructure versus the true long-term cost, which includes sustaining capex, development capex and a host of additional costs including exploration, infrastructure and financing to name a few.
The chart shows the AISC for US shale remains in the vicinity of $US70 per barrel. Much of the current wave of shale production was funded and founded on the premise of $US100/barrel oil, so the supply side will contract at or below this level. In fact, from a peak of 9.61 mboe per day in June 2015, total US production is on the cusp of declining below 9 mboe per day.
Why has the oil price fallen by so much?
If the oil price fall is not from the natural forces of supply and demand, then what has driven the move? In summary, it has been driven by Saudi Arabia’s desire to achieve three or four goals:
- Coerce other OPEC and non-OPEC producers into bearing some of the oil supply side restraint.
- Cripple the existing supply of high cost production, in particular US shale and Canadian oil sands.
- Slow the development of new production in general and high cost production in particular.
- (Possibly) provide a turbo charge to the demand side and a headwind for renewables.
How much this last point is playing on the minds of OPEC ministers is difficult to know, but at the very least it is a nice bi-product of this ‘power play’.
When does this end?
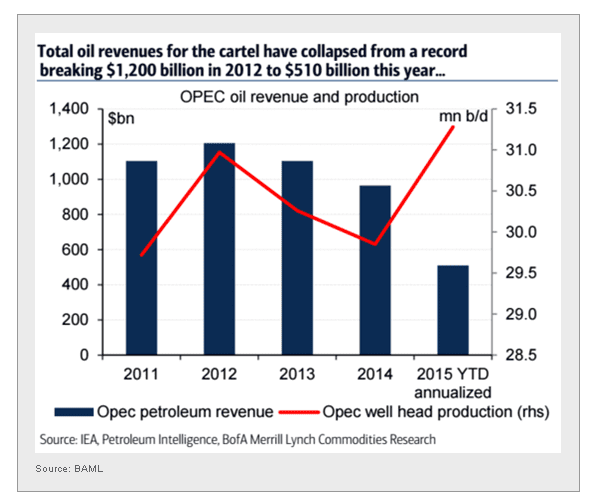
In our view, the oil price will recover when Saudi Arabia has inflicted as much damage as it can whilst bearing as much pain as it can stomach. The second part of this equation is of paramount importance. This process has a finite time line. Saudi Arabia is the largest exporter of oil globally, so the impact of the oil price on their revenues and budget is magnified, as the chart (below) suggests.

When Saudi Arabia has borne as much pain as it can, we will see this Arab leader drive an accord to re-establish order in the oil market. This time may be approaching, as supported by two factors:
Firstly, sentiment has turned as indicated by the break in the downtrend and the upward push through both the 50 and 200 day moving averages (see chart below).

Secondly, the rhetoric emanating from the mouths of the key oil ministers and Government figureheads is undeniably softening. The move to a production freeze is the first tangible evidence of a willingness on the part of the key stakeholders to re-engage. This price fall is politically driven, so the recovery will also arise from government policy.
The key risk of course is that Russia needs to be brought into the fold (ROPEC?) and forced to abide by a supply quota. In theory, when faced with the prospect of financial oblivion versus a large increase in revenue, the choice is relatively pedestrian. The problem here is that when you go Putin’ a gun to the head of the Russian Prime Minister (pun intended) he is just as likely to say ‘pull the trigger’. They don’t call it Russian roulette for nothing!
In the investment world, there is no prize for sitting on the fence. At Katana, we have weighed up the risk-return profile and we now believe it is in our favour. Accordingly, we have been positioning ourselves to profit from a recovery in the oil sector. From this level, if we get the short-term direction wrong, then we expect the long-term fundamentals to cover our mistakes and generate a handsome return to boot.
