Published on Livewire 02/03/2022 (Original Article Here, subscription required) – Romano Sala Tenna
Goldman Sachs recently released a watershed piece of research, based on data from the US Federal Reserve. It demonstrated in a striking manner, the difference between how the wealthy invest versus the masses. For those aspiring to grow their wealth, there is a simple lesson.
As a reference point, the research looked at how the bottom 50% of households (by wealth) invested their money. It found – not surprisingly – that on average 55% of their wealth was tied up in real estate. This is a prudent move. Buying a family home is a critical foundation and platform for building wealth. Not to mention the stability, focus and purpose it brings. Indeed it should very likely be the first major investment for most families.
But that is not the real lesson. More so the issue lies in the fact that such households have only managed to rise above the daily treadmill sufficiently to invest 4% in equities – just 4%.
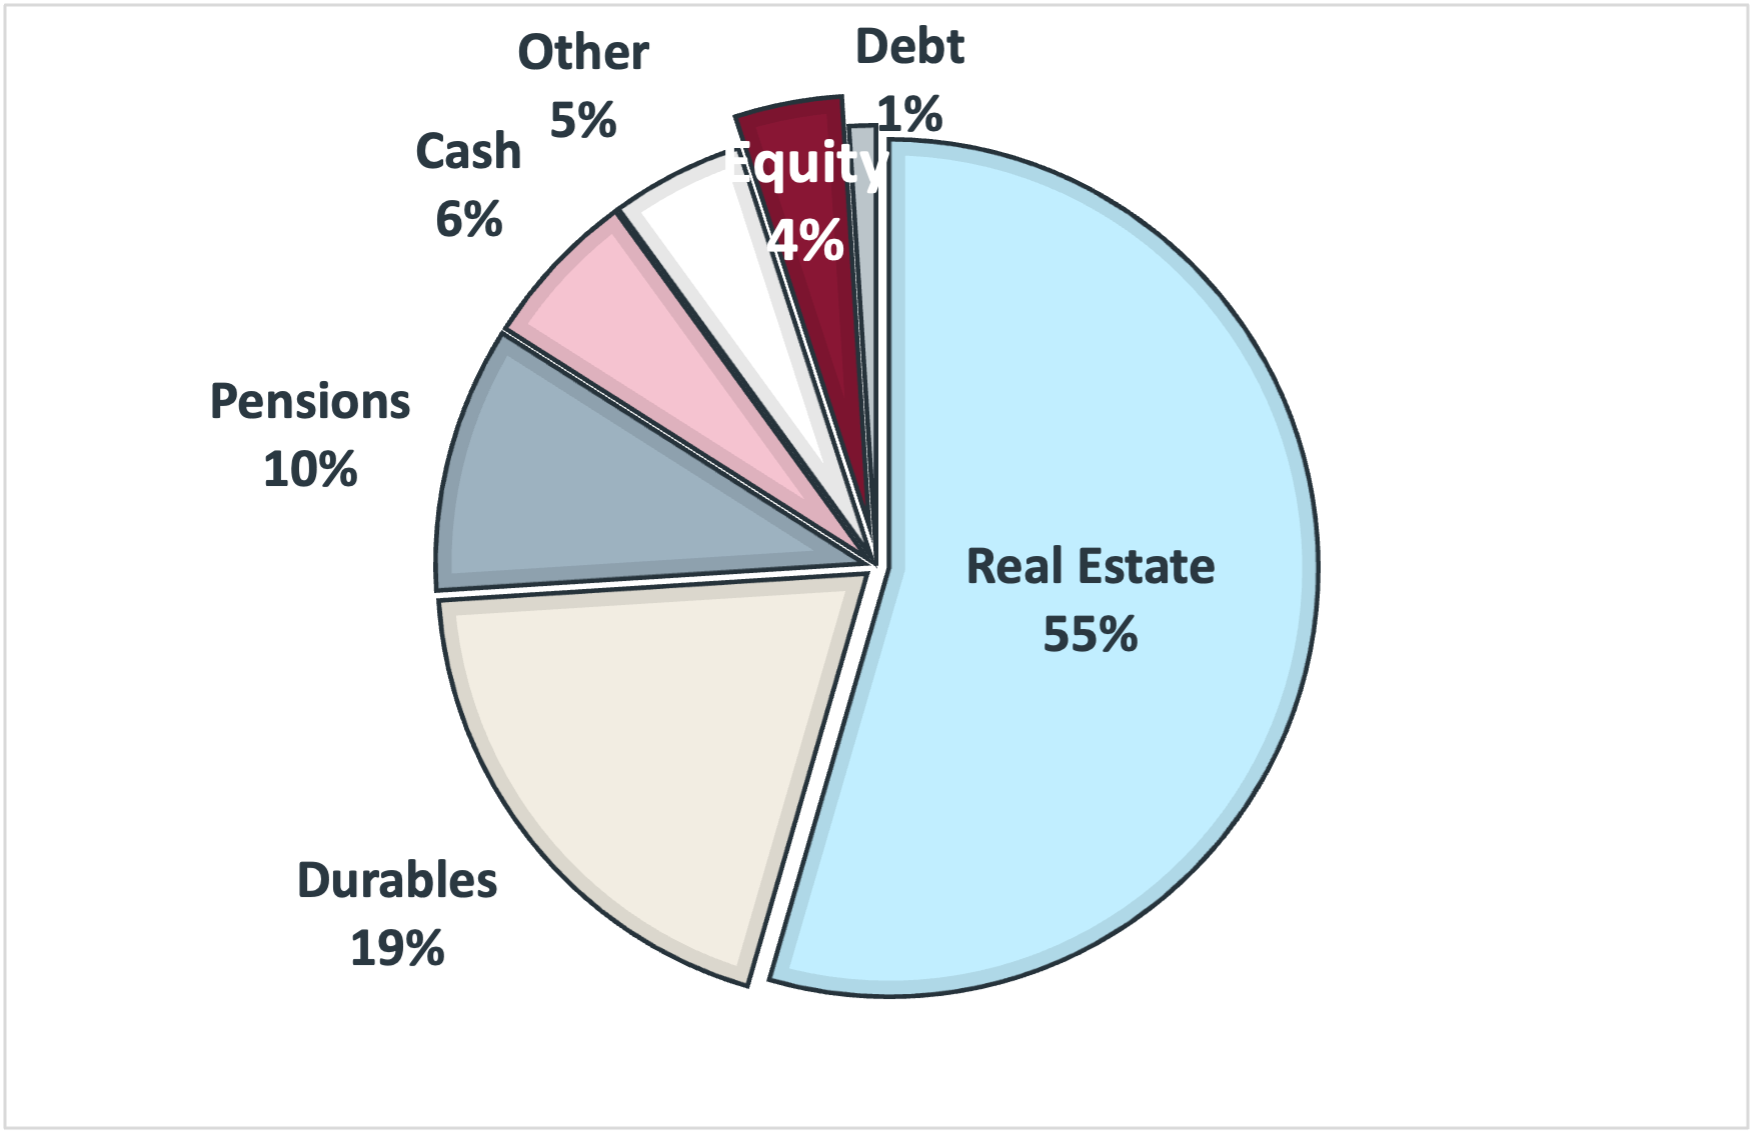
Source (Top and Bottom Charts): US Federal Reserve Bank, Goldman Sachs Research
The comparison with the Top 1% of households by wealth provides the real insight. Across the ultra-wealthy, the average exposure to real estate is just 11%. Whilst 61% of personal wealth is invested in equities. For the well to do, the asset class of choice is shares in companies.
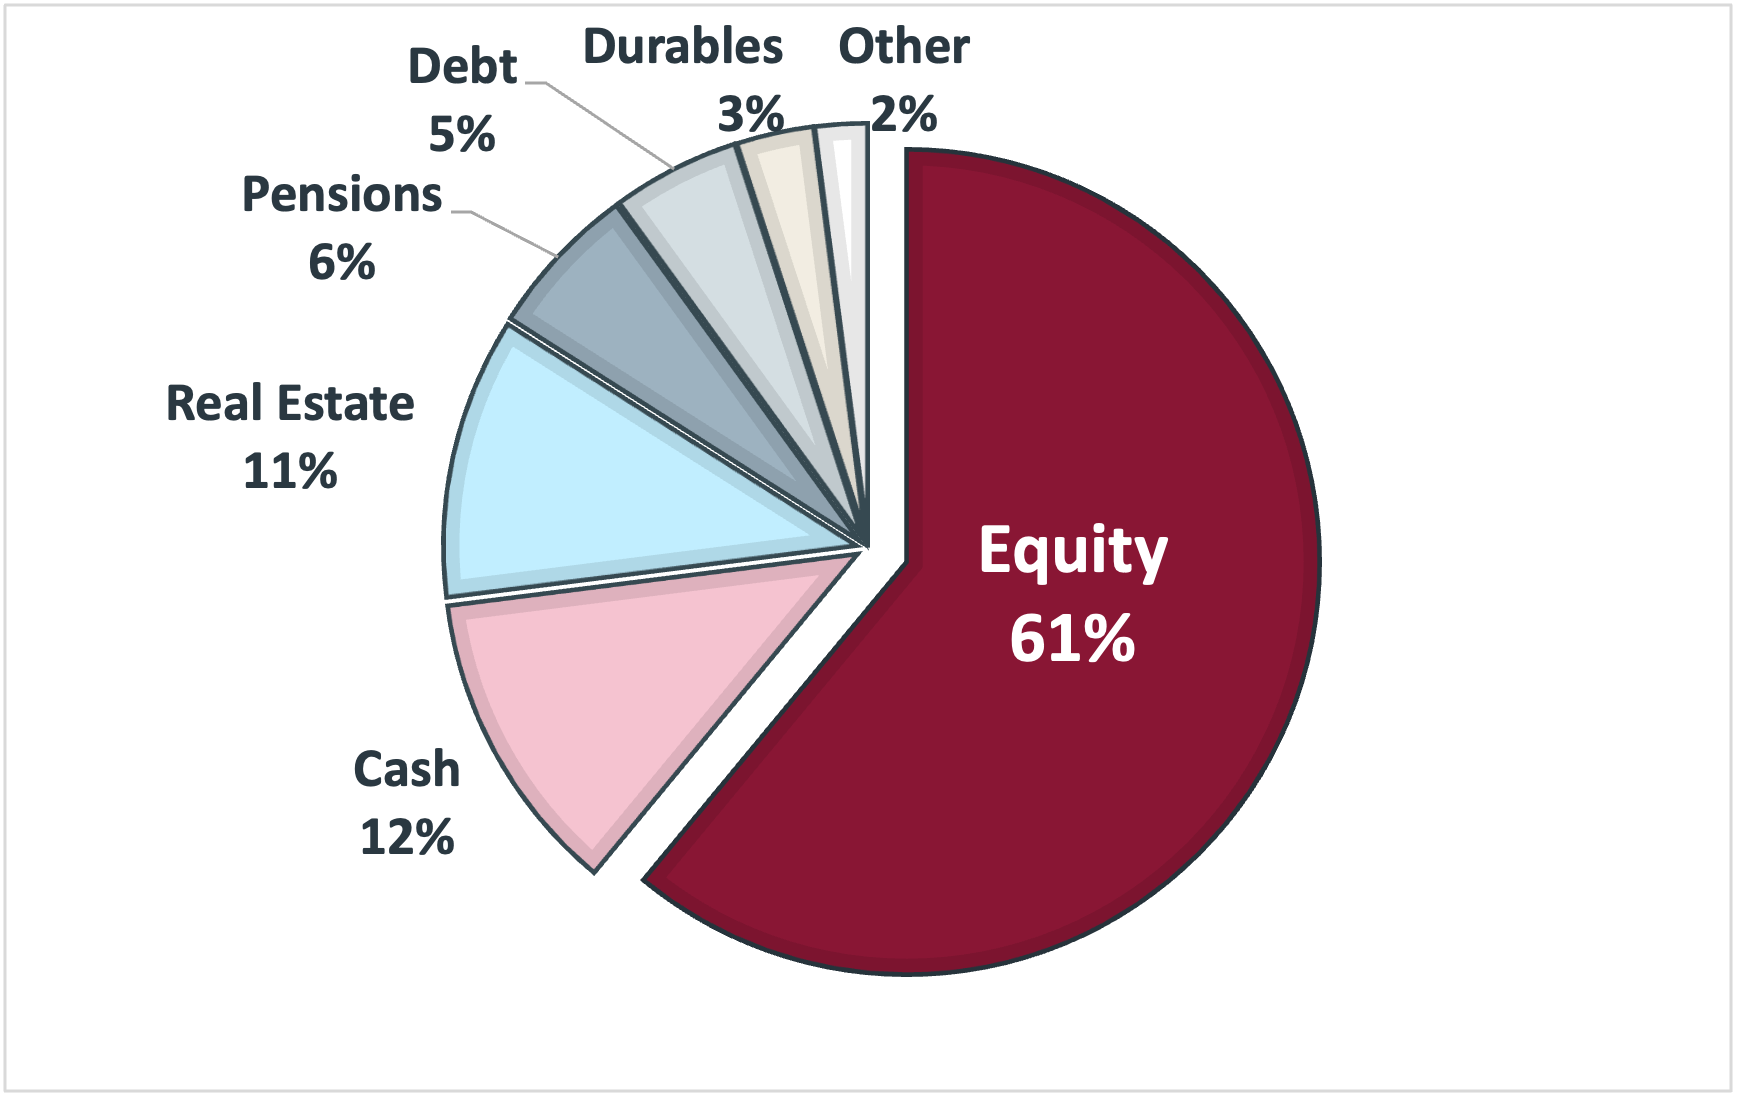
There are of course many reasons for this. Unlike real estate, equities are highly liquid (can be bought and sold easily), transparent (daily pricing), pay a higher yield, don’t require managing tenants and building maintenance and don’t chew up capital in the in the form of horrible taxes such as stamp duty, rates, land tax and others.
But in there is one even more critical element – and that is investment returns. Every cycle there is debate about which asset class is the best performer. And to some degree it depends upon the reference time and the stage in the investment cycle. But here in clear unequivocal terms, the wealthy households are voting with their capital.
In trying to better understand why such a large percentage of capital is allocated to equities, it is worth taking a look over the past 146 years of share market returns in our own country. From the table below, we can see that since 1875, the market has risen 80% of the time (4 out of every 5 years) and by an average of 10.8% per annum (dividends and capital growth).
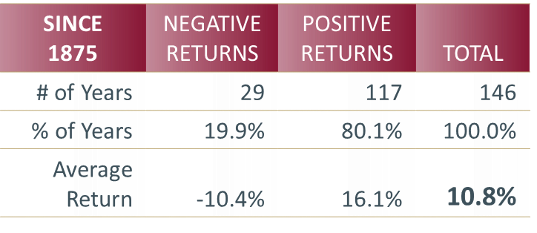
Whilst that is impressive, it only tells part of the story. Because the key to every asset class – including real estate – is compounding.
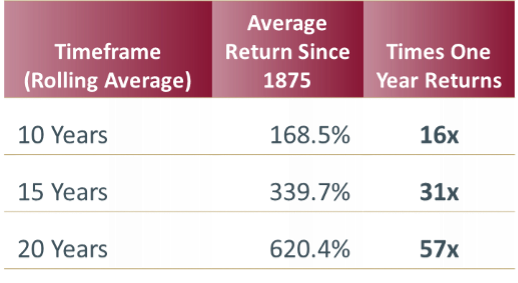
Consider investing in the ASX index for any rolling 5-year period over the past 146 years. With the power of compounding, the average 5 year rolling return has been 65.1%. But compounding that for another 3 years results in the average return nearly doubling to 120.4%.
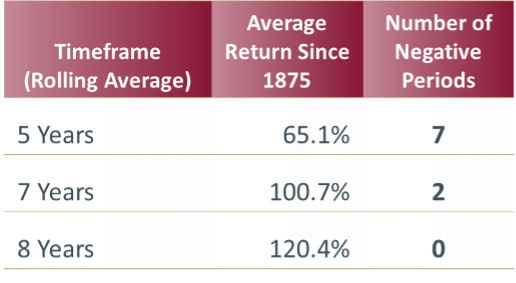
The further out we compound, the more we see the effect.
For example, the average return over 20 years has been 620.4%. And this 620.4% represents the equivalent of 57 years of returns at 10.8% per annum. Over 20 years, the market has generated 57 years of returns through the power of compounding.
These are averages, but they are not fanciful numbers; these are actual returns over the past 146 years.
I am of course obligated to point out that past returns are no guarantee of future performance. And this is true – especially given the volatility over the short to medium term. But the longer the timeframe, the more confidence we can have in the power of compounding to accelerate our returns.
So the lesson is clear. A family home is important – perhaps even critical. But to grow one’s wealth, we need to rise above the daily treadmill, and save enough to start the journey of investing in equities. Superannuation is a wonderful place to do this given the added tax advantages and long-term timeframe. But whatever vehicle you choose, the wealthy have provided the blueprint for those willing to be guided.
