
Published in ShareCafe by Romano Sala Tenna (Portfolio Manager ~ Katana Asset Management) – 18/10/16
As Mark Twain reputedly espoused ‘History doesn’t repeat itself but it often rhymes’.
Whilst there may be a host of reasons as to why this is true, front and centre is the very fact that human nature itself remains largely constant. As passionate beings, we are perpetually bombarded with the same flawed emotional responses to investment decisions. As Jesse Livermore now famously explained it ‘All through time, people have basically acted and reacted the same way in the market as a result of: greed, fear, ignorance, and hope. That is why the numerical formations and patterns recur on a constant basis.’
If that is the case – and my years on the markets would broadly concur – then the graph below the is most important chart I have seen on the gold sector, and is must viewing for all investors interested in this space.
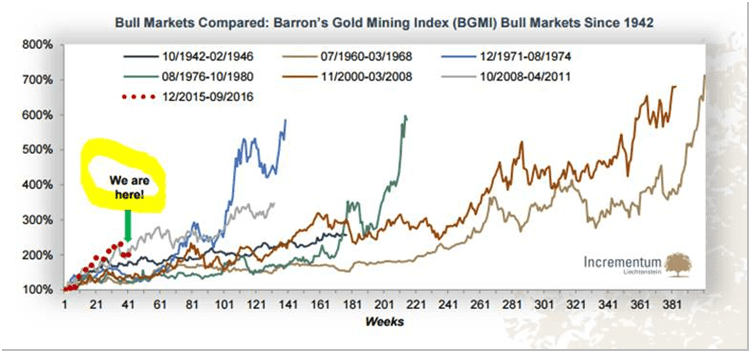 (source: This chart was first published by asset management firm Incrementum Liechtenstein in June. Hartleys Research updated the chart and re-released it during the week).
As this graph clearly shows, the current bull market in gold stocks is less than a year old and represents a total increase in share prices of gold stocks in the Barron’s Gold Mining Index (BGMI) of approximately 100% on a net basis.
Whilst this may seem a sizeable move for many sectors of the market, experienced gold investors would be acutely aware that in the context of past bull markets, it is both the shortest in terms of duration and the smallest in terms of the extent of the rally. Indeed, a high level review of the 6 major bull markets since the 2nd World War, indicates that on average the net increase in stock prices is in the order of 400% and both the median and modal or most common outcome is ~500% (net).
A similar occurrence may be noted on the Australian market. The ASX/S&P Gold Index (XGD) has risen from ~2,200 in December 2015 to approximately 4,400 today – a closely correlated rise of 100%.
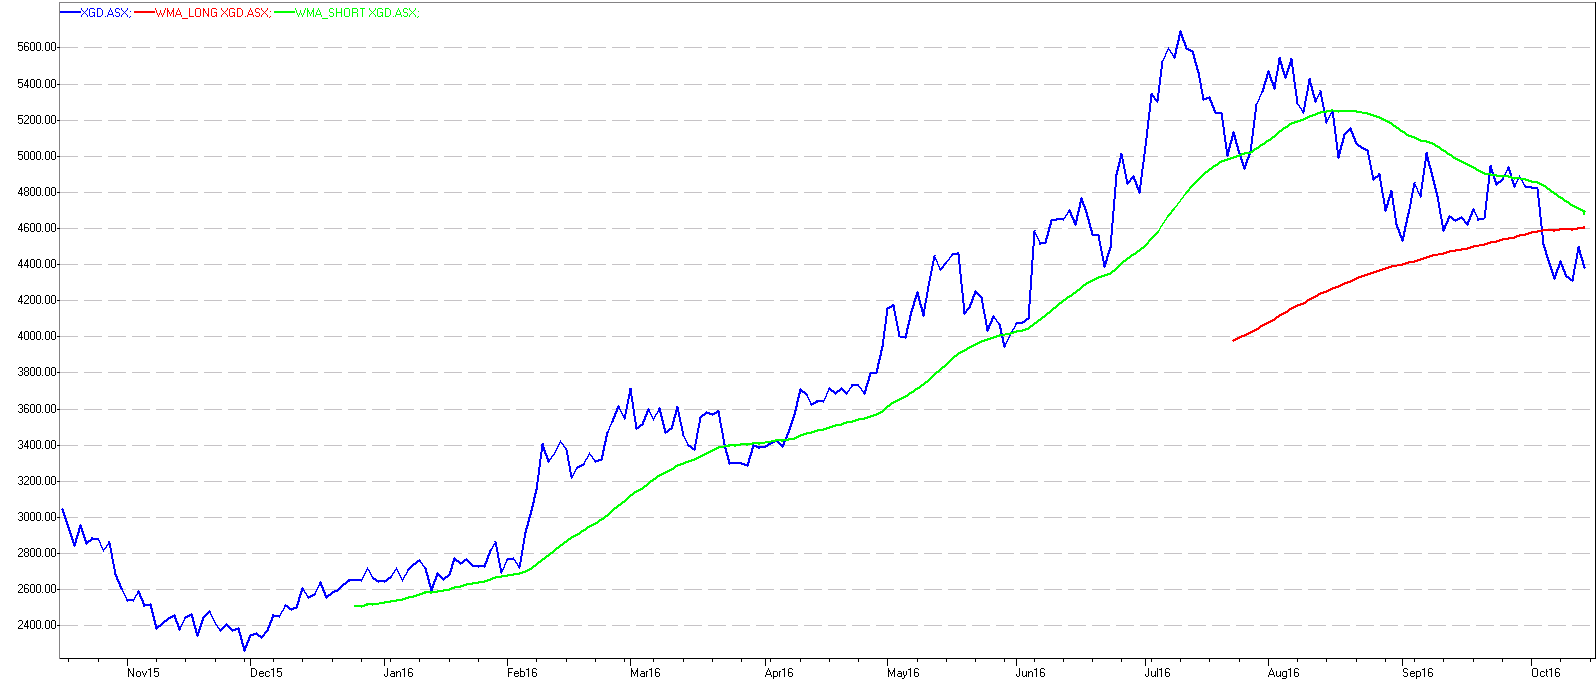
During the prior rally from 2001 to 2011, the Australian Gold Index rose from less than 1,200 to more than 8,500 – a similar move to its international peers of nearly 600%.
So in short, history would indicate that we are at the early stages of a gold bull market that has a long way to run in terms of both duration and quantum.
But before investors go barrelling in, they should also heed another lesson that history has to offer. And that put simply is that few sectors are as volatile or as brutal on timing as the gold sector. By way of example, from a high of 8,500 in April 2011, Australian listed gold stocks declined by more than 80% as the index plummeted to 1,642 by late 2014. In other words, a $10,000 investment would have declined in value to around $2,000!
So the gold sector should be treated with particular respect, diligence and caution. Indeed to some degree this sector is the realm of professional investors. For retail investors, they should take very modest positions, run clinical stops and only ‘invest’ capital that they can afford to lose.