
History reinforces the benefits of long-term portfolio investing.
Originally published in the ASX Newsletter (Source: here)
The macro outlook is worrisome:
- Monetary policy worldwide is on the brink of exhaustion;
- US debt to gross domestic product (GDP) is the second highest on record;
- Japanese government debt is running at 250 per cent of GDP and total national borrowing is a staggering 600 per cent;
- and in China, debt exploded from US$2.1 trillion in 2000 to US$30 trillion by 2015 and is forecast to grow by 27 per cent of GDP this calendar year (McKinsey Global Institute analysis).
Australia is not immune to the debt gorge, with the OECD noting that the household debt-to-GDP ratio has grown from 56 per cent in 1990 to 206 per cent today.
In short, we find ourselves amid a debt tsunami, with a diminishing arsenal of policy tools and options.
This may lead investors to feel this is not the time to invest in anything, let alone shares, and to some extent investors are right to be particularly cautious.
At Katana, we currently hold an above-average level of cash and recognise the global economy may well get worse before it gets better. As we are prone to say internally, the short term is unknowable.
But the reality is that the global economy has found itself in worse situations than the present one and many of the problems are known knowns; it is precisely the focus on these problems that has largely contributed to the “lost decade” for Australian equities.
At times such as these, it is paramount to take a step back and get some perspective on the present day through the lenses of history. In the case of Australian shares, we are fortunate to have 141 years of past data that can provide a guide to the future.
(The earliest “recognisable” closing calendar year data is from 1875, generating the first full-year of performance data for the 1876 calendar year.)
Three standout themes
1. Positive years are substantially more common
Over the past 141 years, Australian shares (including dividends) have generated a positive return on 113 occasions, or 80.1 per cent of the time.
The average return during positive years was 16.1 per cent per annum and during negative years the market fell by -10.6 per cent per annum. When we consider the 113 positive years and 28 negative years, the average return has been 10.8 per cent per annum since 1875.
| SINCE 1875 | NEGATIVE RETURNS | POSITIVE RETURNS | TOTAL |
|---|---|---|---|
| Number of years | 28 | 113 | 141 |
| % of years | 19.9% | 80.1% | 100.0% |
| Average return | -10.6% | 16.1% | 10.80% |
Sources: ASX, IRESS, Bloomberg
In 1979, the All Ordinaries Accumulation Index was established, which provides a higher level of accuracy as it considers precise dividend payments, as opposed to approximations used before this time. Including negative years, the market has returned an even stronger average of 13.3 per cent per annum (including dividends).
(Precise actual dividends are unknown prior to the development of the All Ordinaries Accumulation Index in 1979. Since then, the average dividend yield of the index has been 4.52 per cent. To determine the total per annum return before 1979, a dividend yield of 4.5 per cent was added to the capital return data point to determine an approximation of total return.)
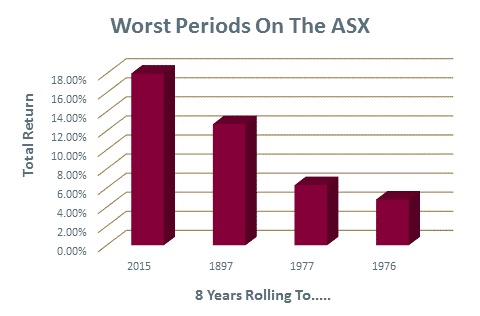
. A period of unusually low returns
The period ending 2015 was one of the most challenging on record. For example, the All Ordinaries index peaked at 6,873 in November 2007. Today, it is hovering around 5,800 – some 1000 points, or 15 per cent, below where it was nearly a decade earlier.
If we include dividends and take an even longer-term perspective, we find that the eight-year period ending 2015 is the fourth worst on record.
Source: Katana analysis
3. Over the longer term, expect higher returns
To get some real perspective on Australian shares, we can do some analysis of what has occurred over the past 141 years.
Consider what would happen if an investor was to simply purchase the main ASX index, turn off their screen, go away and come back in five years. What would the “average” return be?
We can see below that on any five-year average rolling period, the market has returned 65.5 per cent over the past 141 years, considering negative years and including dividends.
Additionally, over a five-year timeframe, there were seven occasions when an investor would have experienced a negative return.
If we extend the same approach, but for seven years, the average return was 101.3 per cent and only twice would an investor have received a loss.
Over any given eight-year period since 1875, the average return was an impressive 121.2 per cent. And just as importantly, there were no occasions when the investor would have generated a negative return.
| Timeframe (rolling average) | Average return since 1875 | Number of negative periods |
|---|---|---|
| 5 years | 65.5% | 7 |
| 7 years | 101.3% | 2 |
| 8 years | 121.2% | 0 |
Source: Katana analysis
Note that these are averages. The range of individual outcomes varied from 4.8 per cent (eight years ending 1976) to 446 per cent (eight years ending 1986).
This highlights how critical it is that investors have an appropriate timeframe. For example, there was a 19.9 per cent chance of incurring a loss over a 12-month period, but a zero per cent chance if invested for eight or more years.
(Past returns are no guarantee of future returns. Equity markets are volatile and unpredictable; despite an extensive dataset, future outcomes could deviate from historical returns.)
This serves to illustrate another theme in this article: The long term is inevitable; over the longer term, the market will inevitably rise.
At Katana, we like to say “there is only one long-term trend”. And nothing illustrates this better than to consider that at the close of 1875, the “index” was at 4.75 points. Today, even after the fourth worst period in the history of the Australian exchange, the S&P ASX All Ordinaries Index has risen to 5,500 plus.
Summary
- Australian shares have generated a positive return 80.1 per cent of the time. Including negative years, it has returned an average of 10.8 per cent per annum for the past 141 years.
- We are in a period of unusually low returns, the fourth worst in the history of the Australian market.
- An investing timeframe is essential. Over any given eight-year rolling period, Australian shares have returned an average of 121.2 per cent, and there has been no occasion when the index plus dividends has generated a negative return.
Indeed, the short term may be unknowable, but the long term truly is inevitable.